Adobe Audit is one of the many processes available in the Syntasa platform that users can utilize while creating apps. The process is available in all three modules, Synthesizer, Composer, and Orchestrator.
Using data prepared in the Adobe Analytics app, the Adobe Audit process is responsible for auditing the Syntasa event table using specific metrics against the corresponding metrics in Adobe Analytics via the Adobe reporting API. This process is dependent on access to the configured Adobe API and a processed tb_event table.
This article reviews the steps to utilize the Adobe Audit process:
Reviewing the prerequisites
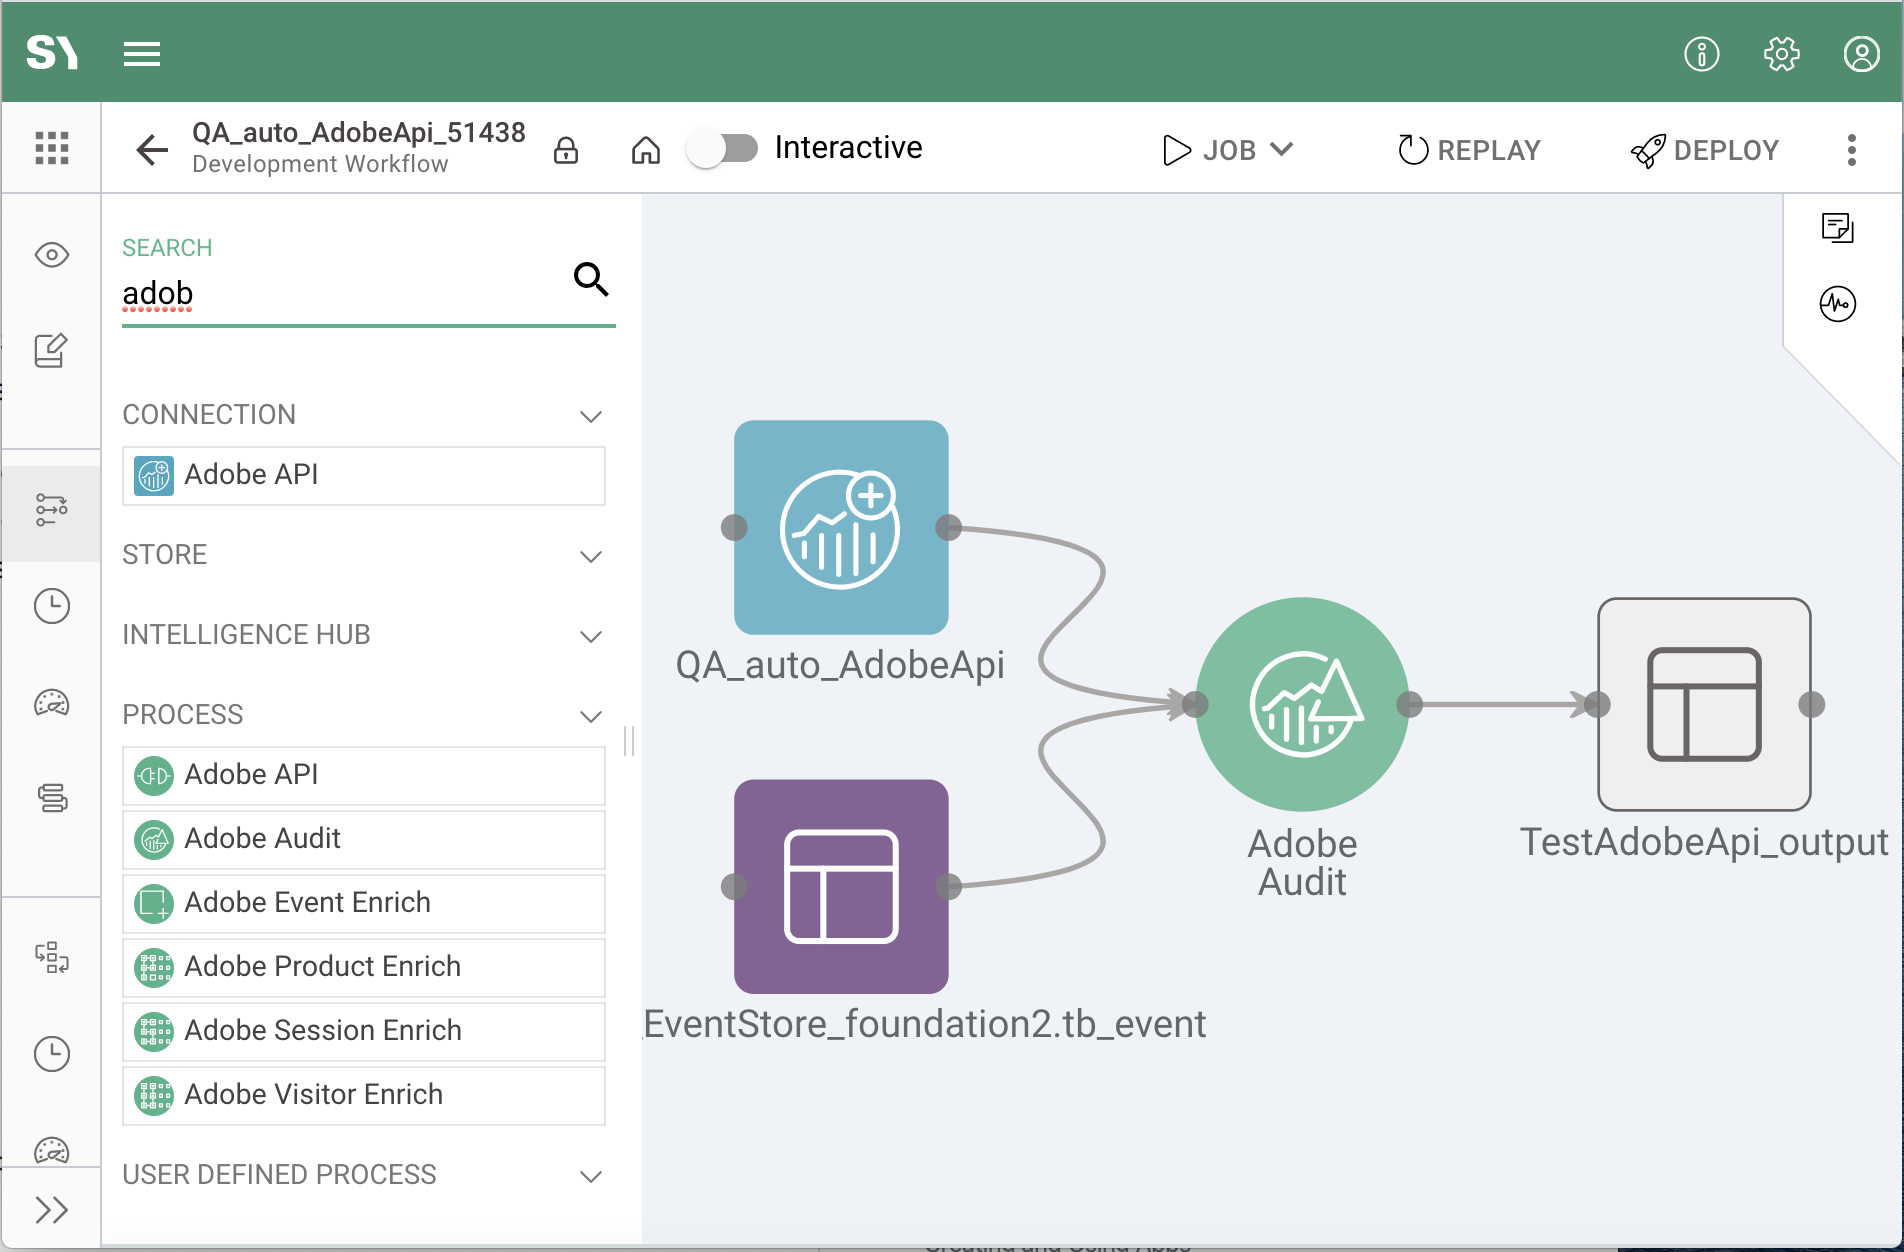
When dragging the Adobe Audit process onto the workflow canvas the output table, seen below, will also be created. In order for the process to be able to perform the audit of the Adobe data, and thus record its results in the output table, the process needs two inputs: Adobe API connection and the tb_event table that is to be audited.
Adobe API
The Adobe Audit process will utilize the metrics available in Adobe Analytics by using an Adobe API connection as an input, which should be created previously. The connection node (![]() ), not be confused with the Adobe API process node (
), not be confused with the Adobe API process node (![]() ), needs to be dragged onto the canvas; configured, which is done by clicking on the node and selecting the appropriate connection from the drop-down; and connected to the Adobe Audit process node.
), needs to be dragged onto the canvas; configured, which is done by clicking on the node and selecting the appropriate connection from the drop-down; and connected to the Adobe Audit process node.
tb_event
Similarly, an event store node (![]() ) needs to be dragged onto the workflow canvas; configured, which is done by clicking on the node, selecting the event store name where the tb_event table that is to be audited resides, and then selecting the tb_event table name; and then connected to the Adobe Audit process node.
) needs to be dragged onto the workflow canvas; configured, which is done by clicking on the node, selecting the event store name where the tb_event table that is to be audited resides, and then selecting the tb_event table name; and then connected to the Adobe Audit process node.
The tb_event table is likely setup and processed in the platform via an Adobe Analytics Input Adapter app.
Configuring the Adobe Audit process
The Adobe Audit process includes two screens needed for configuration. Clicking on the process node (![]() ) will open the panel at the bottom of the screen where the Parameters section needs to be completed for setting up the audit configuration and the Output section for definitions of the output results.
) will open the panel at the bottom of the screen where the Parameters section needs to be completed for setting up the audit configuration and the Output section for definitions of the output results.
Parameters
The Parameters section provides the information Syntasa needs for connecting to the customer's Adobe Report Suite, the frequency of the audit, and recipients of the audit results.
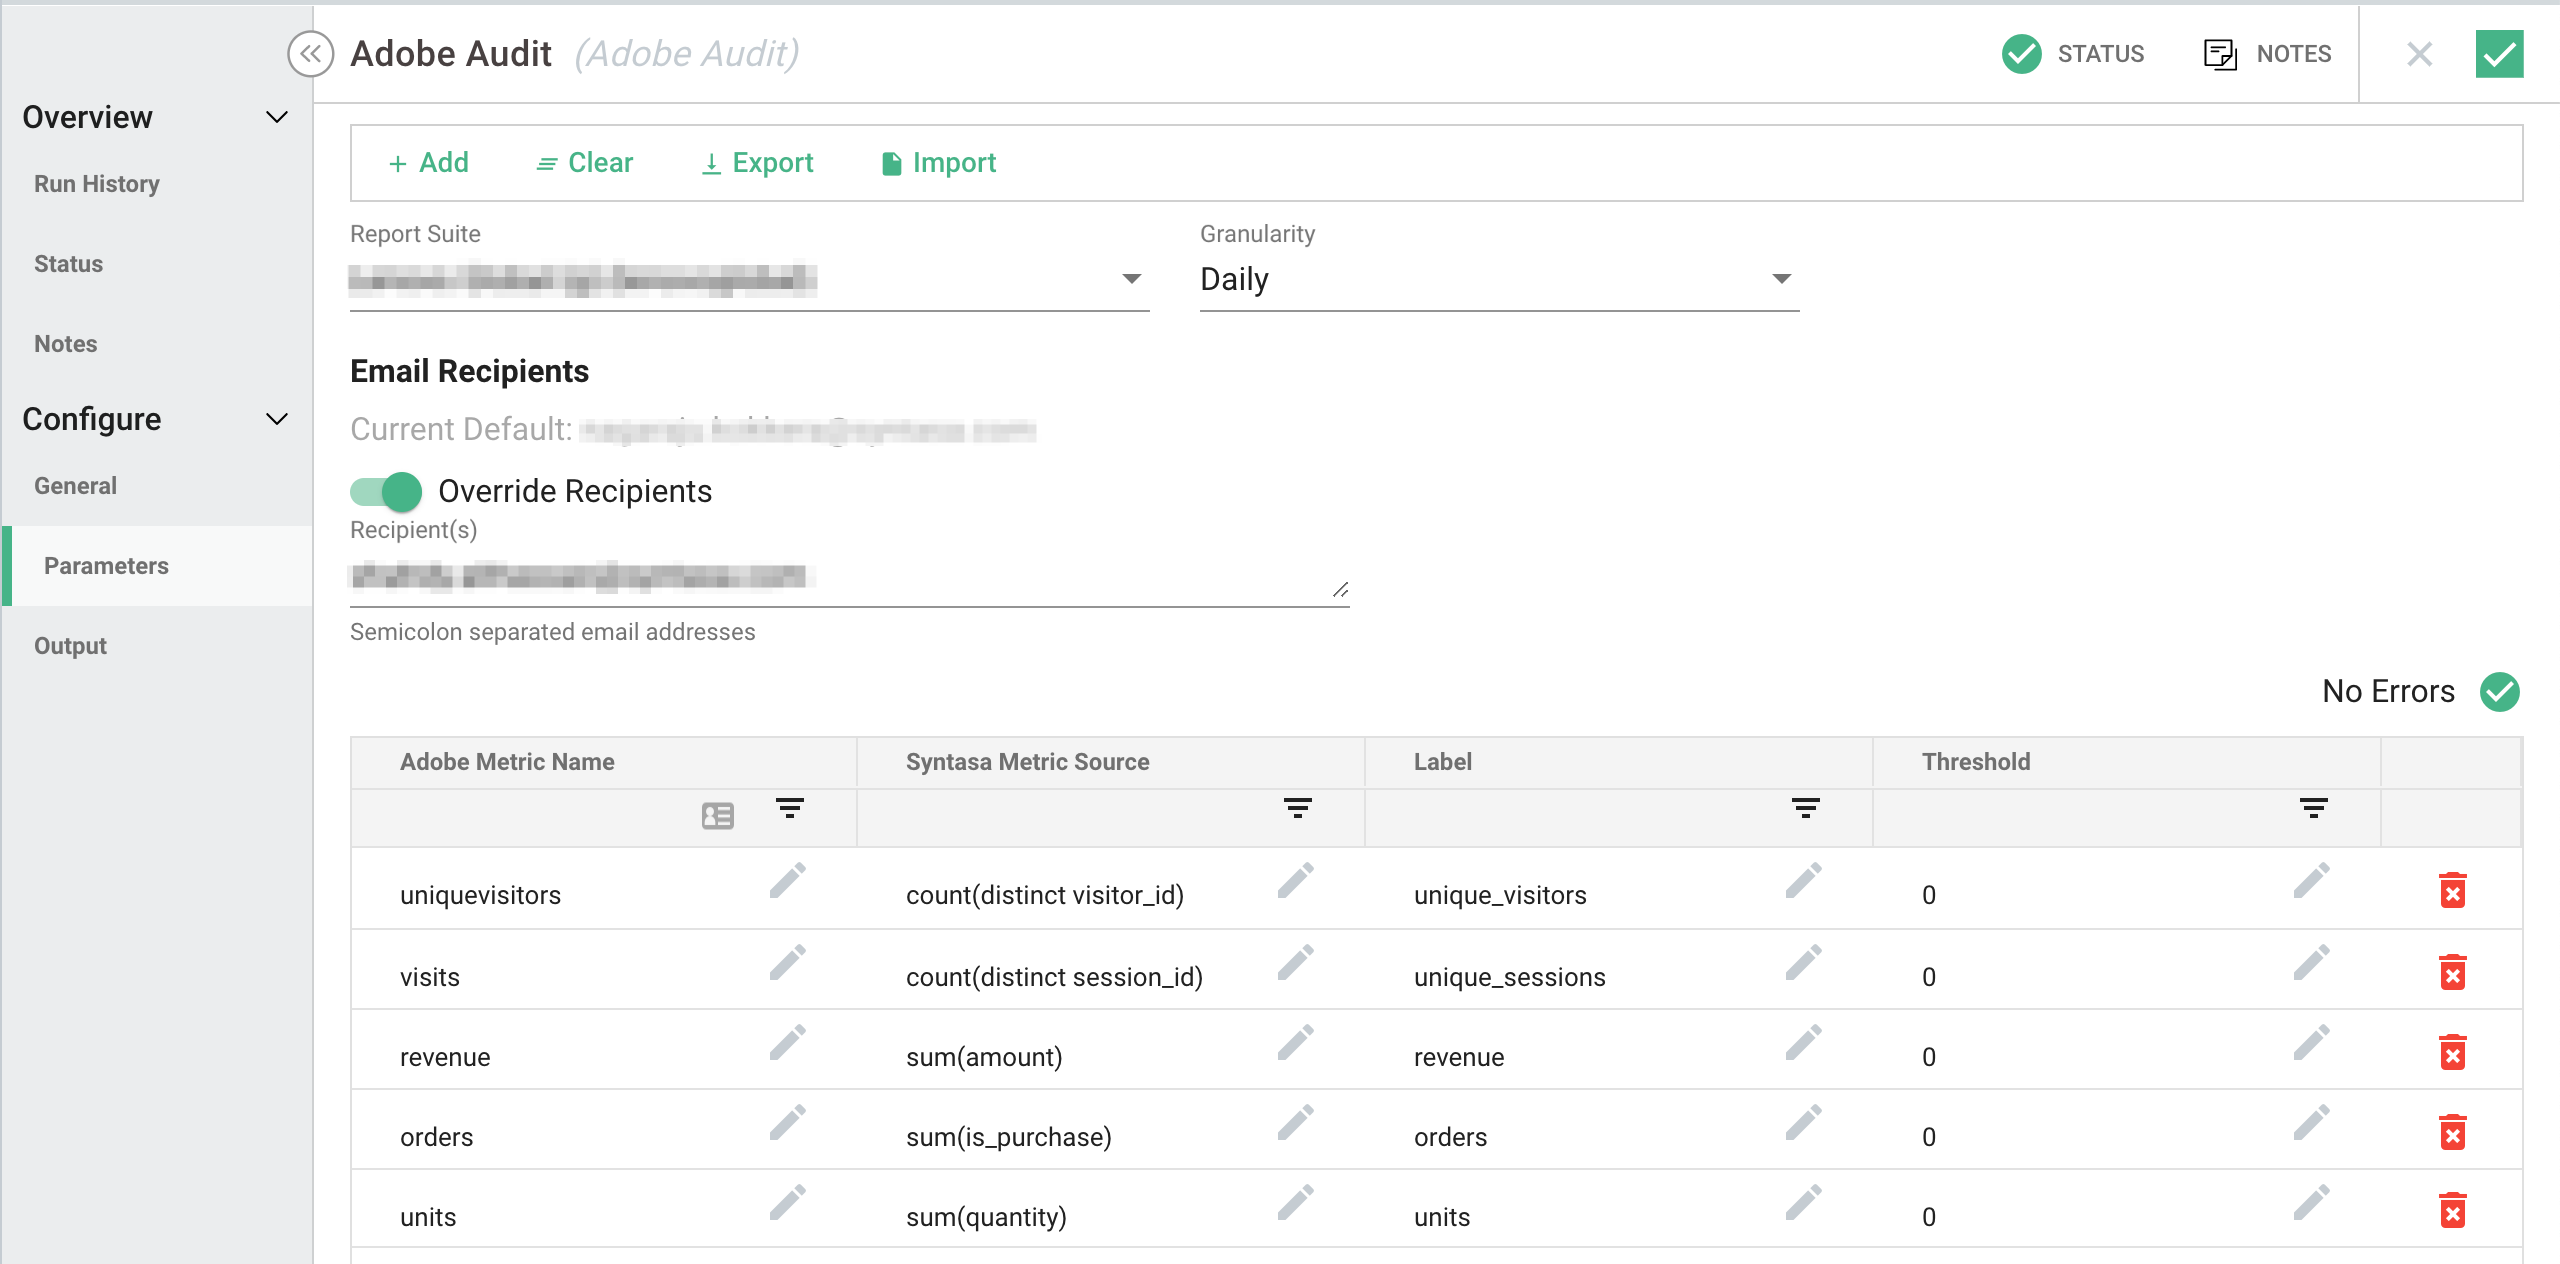
Report Suite - The customer's Adobe Report Suite name that is associated with the dataset processed in the Syntasa Adobe Analytics app.
Granularity - The frequency that the Syntasa application will poll the Adobe Report Suite - Daily or Hourly.
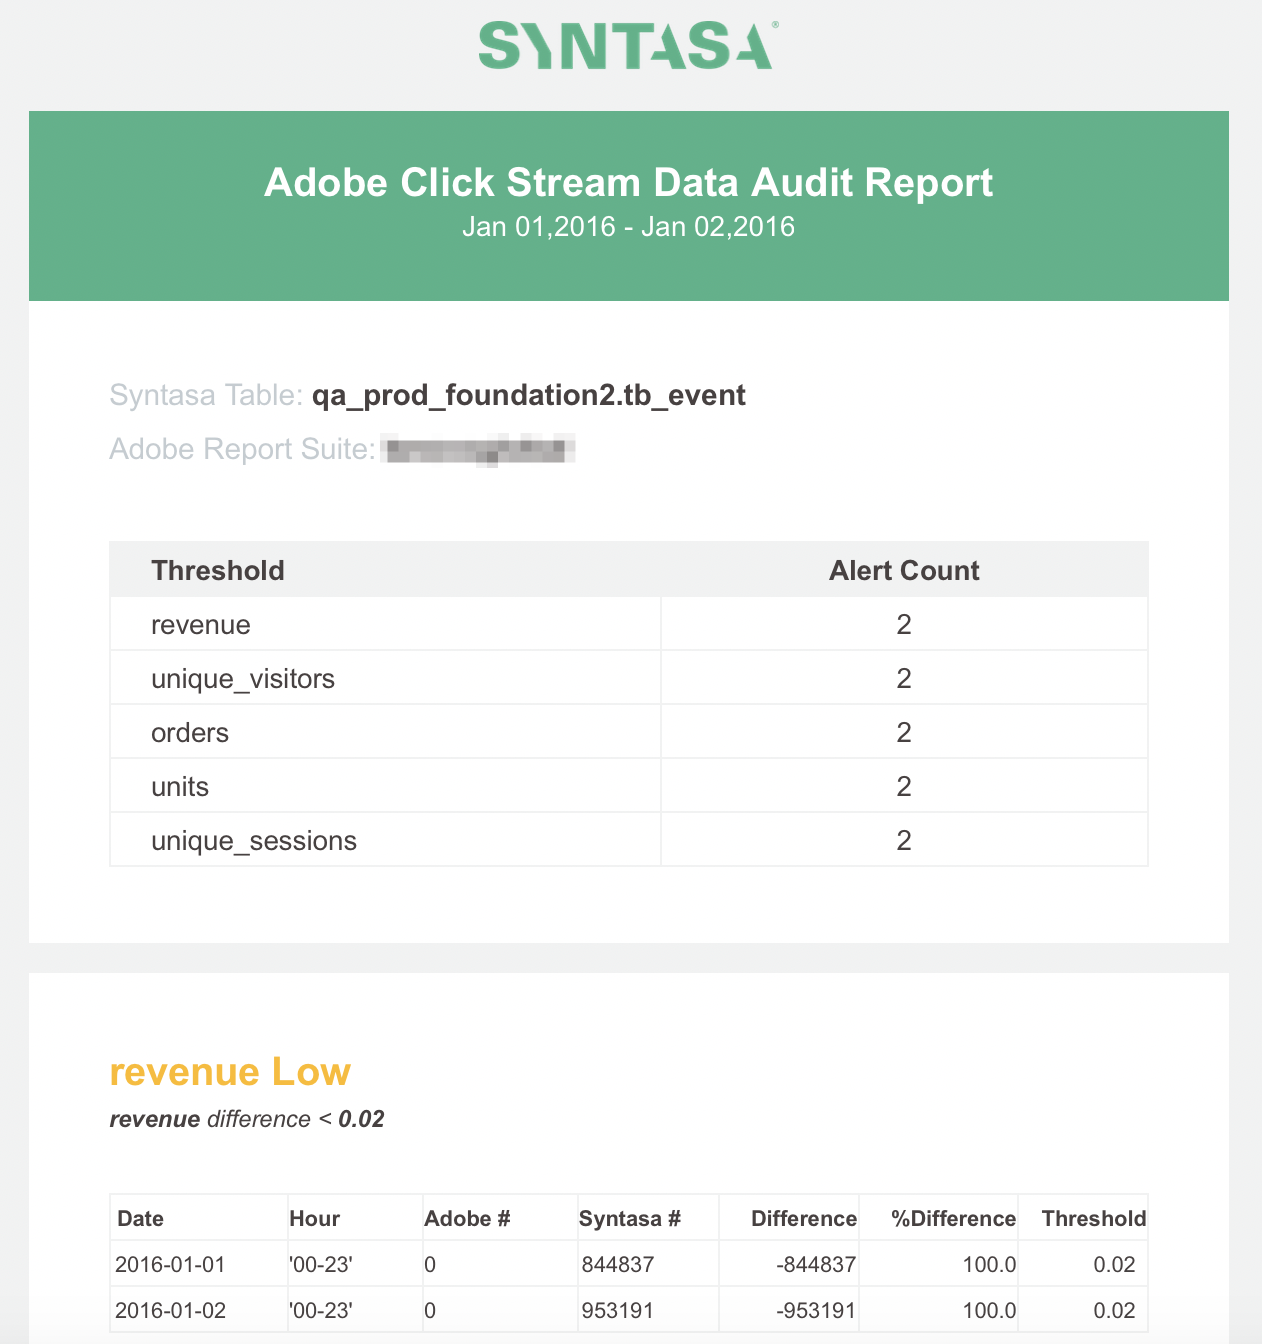
Email Recipients - The system default recipient can be overwritten to receive the email notification that is sent on the completion of the Adobe Audit process. A sample of the email notification is seen below:
Thresholds - The bottom portion of the parameters section provides the ability to configure the threshold values for the various metrics that are compared between the Adobe API versus the those counted in the processed tb_event.
Output
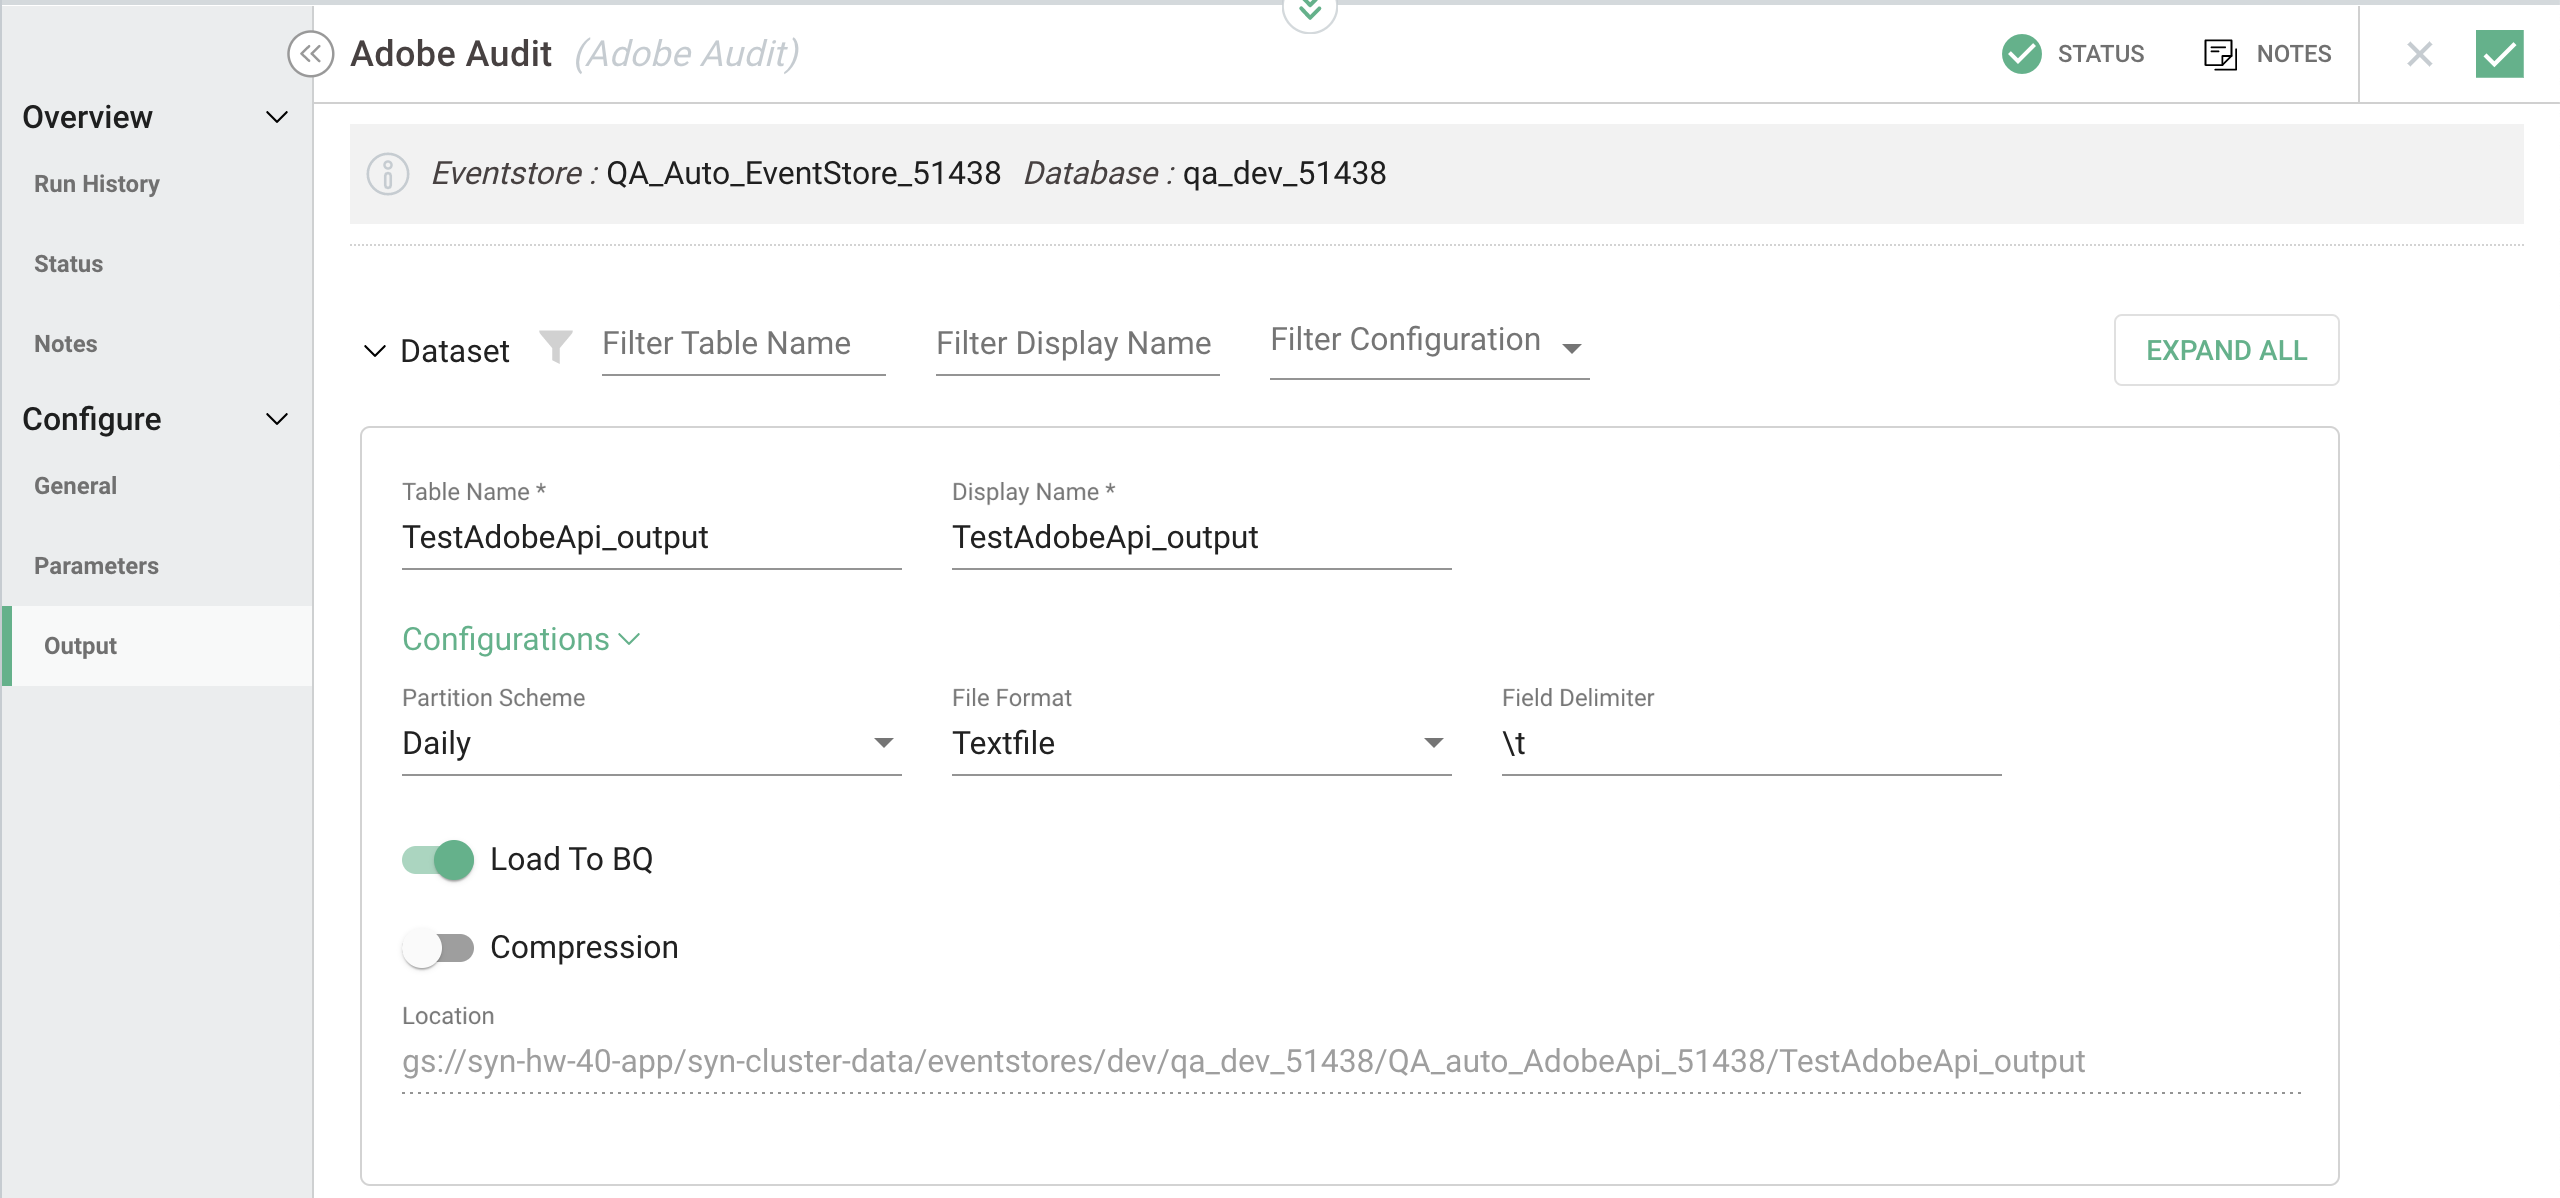
The Output section provides the ability to name the output table and how the output process should be labeled on the app graph.
Dataset
Table Name - This defines the name of the database table where the output data will be written. Please ensure that the table name is unique to all other tables within the defined event store, otherwise, data previously written by another process will get overwritten.
Display Name - The label of the process output icon displayed on the app graph canvas.
Partition Scheme - Defines how the output table should be stored in a segmented fashion. Options are Daily, Hourly, None. Daily is typically chosen.
File Format - Defines the format of the output file. Options are Avro, Orc, Parquet, Textfile.
Field Delimiter - Only available if the file format is selected as a text file, this defines how the fields should be separated, e.g. \t for tab-delimited.
Load To BQ - This option is only relevant to Google Cloud Platform deployments. BQ stands for Big Query and this option allows for the ability to create a Big Query table. If using AWS, this will have the option to Load To RedShift and if an on-premise installation data is normally written to HDFS and does not display a Load To option.
Compression - Option selected if data is to be compressed.
Location - This is automatically generated, and not editable, based on the paths and settings of the event store the app is created in, the key of the app, and the table name given above.
Evaluating the output
When the Adobe Audit process is run, the following steps are being taken:
- The process finds the date range for which it is configured to run.
- It utilizes the configured Adobe API connection to run Report API for the specified date range to get an hourly breakdown for the Number of unique visitors, Number of unique sessions, Revenue, Units, and Total orders.
- It then runs a KPI query on the tb_event table to get an hourly breakdown for the Number of unique visitors, Number of unique sessions, Revenue, Units, and Total orders.
- Lastly, the two sets of metrics are correlated and the differences, if any, are examined against the defined thresholds for each metric. If the difference is above the defined metric then the result is captured in the defined output table.
The results can be seen by clicking on the output table (![]() ) that is created when the Adobe Audit process is dragged onto the workflow canvas. Clicking on the output table displays information about the table including Details, Schema, State, and Preview:
) that is created when the Adobe Audit process is dragged onto the workflow canvas. Clicking on the output table displays information about the table including Details, Schema, State, and Preview:
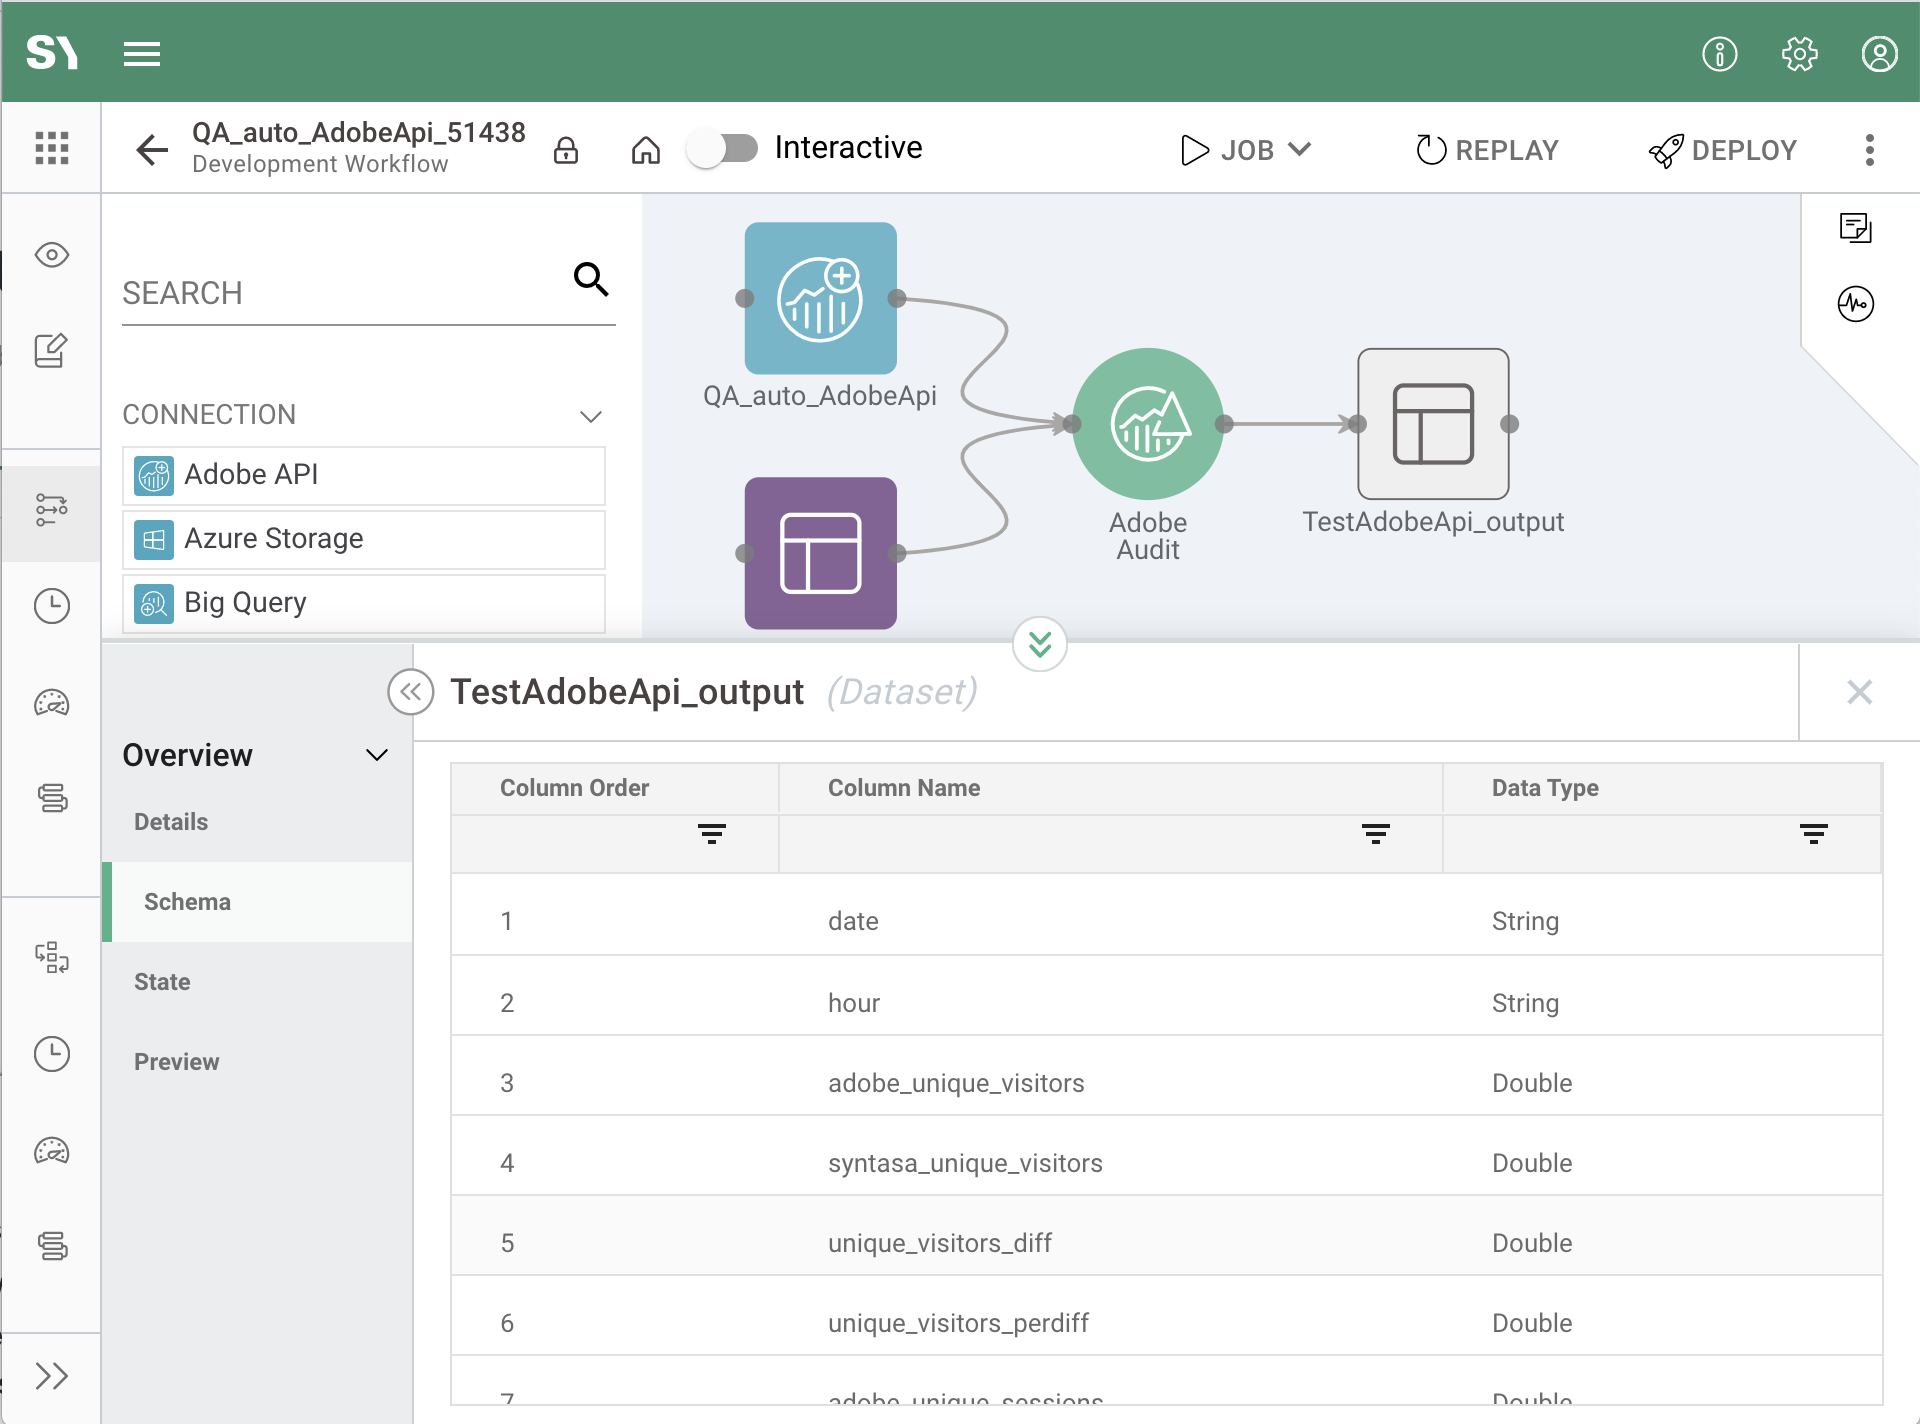
The output table can be queried directly using an enterprise provided query engine, but also, as noted above, the differences found can be sent via email to notify the recipients of the differences found by the audit process.